The short answer
To get a number you can trust, test from a wired laptop plugged directly into your router or gateway, using a network port fast enough for your plan. Standard Gigabit Ethernet tops out near 941 Mbps of real TCP throughput, so a plan above ~940 Mbps needs a 2.5G, 5G, or 10G port to measure honestly. Close other apps, pause any VPN or traffic-scanning security software, run a reputable test to a nearby server three to five times, and compare the median against your provisioned rate. On a wired connection you should see roughly 90 to 94 percent of the plan number; the missing 6 to 10 percent is protocol overhead, not a fault. Keep your units straight too: plans and tests are quoted in megabits per second (Mbps), while file transfers show megabytes per second (MB/s). There are eight bits in a byte, so a 1,000 Mbps link downloads at about 118 MB/s, not 1,000.
Two tests disagree because 'your speed' is not a single fixed property of the line. It is an estimate of the narrowest bottleneck on one specific path, at one specific moment, using one specific method. The result depends on how many parallel TCP connections the test opens, which server it picks and how far away that server sits, how much latency and packet loss the path carries, whether you are on Wi-Fi or a wire, and whether the limiting factor is your device, your local network, your ISP's access link, or a congested interconnect between networks. Change any one of those and the number moves. A 20 to 30 percent spread between two honest tools run minutes apart is normal and does not mean either one is lying, it means they made different measurement choices.
What a Speed Test Actually Measures
A speed test measures goodput, the rate of usable application data your device can push or pull through the current bottleneck, sustained over a few seconds. That is not the same as the line rate your ISP advertises. The advertised number is the signaling rate at the physical layer; the test measures what survives after Ethernet framing, IP headers, and TCP headers are stripped away. With a standard 1,500-byte MTU, each packet carries about 1,460 bytes of payload under 40 bytes of IP and TCP headers, and each Ethernet frame adds another ~38 bytes of preamble, framing, and inter-packet gap. That stack is why a nominal 1,000 Mbps Gigabit Ethernet link delivers about 941 Mbps of TCP throughput even under perfect conditions.
Because the test only ever sees the narrowest link in the chain, the number is a snapshot of one bottleneck, not a property of your subscription. That bottleneck can sit in your laptop's Wi-Fi radio, an old Cat5 patch cable, a 1G port on a router serving a 2G plan, the ISP's access link, or an interconnect two networks away. A good measurement strategy is really an exercise in moving the bottleneck somewhere you can see it, then reading the number there.
Many ISPs also provision the access link slightly above the plan rate, often 5 to 15 percent, so a well-run wired test on a gigabit plan can legitimately read 950 Mbps or higher. Reading slightly over the plan is normal headroom, not an error in the test.
- Goodput (measured) is always lower than line rate (advertised) because of layer-1/2/3/4 overhead
- Gigabit Ethernet ceiling for a single TCP stream is about 941 Mbps, not 1,000
- 1 byte = 8 bits: 1,000 Mbps equals about 125 MB/s theoretical, ~118 MB/s after overhead
- The test reports the narrowest bottleneck on the path, wherever it happens to be
- ISP overprovisioning of 5 to 15 percent can make a wired test read slightly above the plan
Single vs Parallel Connections: The Biggest Reason Tests Disagree
The single largest source of disagreement between tools is how many TCP connections they open. TCP is self-limiting: each connection ramps up its congestion window gradually (slow start, then congestion avoidance) and cuts that window sharply whenever it detects a lost packet. On a fast or long-distance path, one connection often cannot open its window fast enough, or wide enough, to fill the pipe before the test ends.
The governing quantity is the bandwidth-delay product, the amount of data that must be in flight to keep a link full: bandwidth multiplied by round-trip time. A 1 Gbps path with 30 ms of latency needs about 3.75 MB in flight at all times. A single stream that hits even a tiny amount of packet loss keeps halving its window and may never sustain that much, so it reads far below the true capacity. The Mathis approximation captures it: single-stream throughput is roughly MSS divided by (RTT times the square root of the loss rate), which means latency and loss punish one connection hard.
This is exactly why the widely used tests open several parallel connections at once. Multiple streams collectively fill the bandwidth-delay product and ride out individual packet losses, so the aggregate reaches the real capacity. A tool or mode that uses a single connection will report a lower, and often more variable, number on the same line, especially on high-latency or multi-gigabit links. Neither is wrong; the parallel test measures capacity, while a single stream measures what one download or one upload can achieve.
- A single TCP stream is limited by congestion control, latency, and packet loss
- Bandwidth-delay product = bandwidth x RTT; 1 Gbps at 30 ms needs ~3.75 MB in flight
- Any packet loss makes one stream repeatedly halve its window and under-read
- Parallel connections aggregate to fill the pipe and absorb individual losses
- Ookla Speedtest and Fast.com open multiple streams by default; single-connection tools read lower
- Match the method to the question: capacity (parallel) vs single-file transfer (one stream)
Why a Wired Laptop Beats Wi-Fi
Wi-Fi is a half-duplex, shared medium: only one device can transmit on a channel at a time, and the airtime is split among every client and the access point talking on that channel. On top of that, 802.11 carries substantial MAC-layer overhead (contention windows, acknowledgements, guard intervals, management frames) and retransmits frames when they are corrupted by interference. The result is that real TCP goodput over Wi-Fi is typically only 40 to 60 percent of the PHY rate your device reports.
Concretely, a common Wi-Fi 5 (802.11ac) 2x2 client on an 80 MHz channel negotiates an 866 Mbps PHY rate but usually delivers 350 to 500 Mbps of actual throughput. A single-antenna (1x1) phone, a 2.4 GHz connection, a narrower channel, distance from the AP, or a neighbor's overlapping network can push that far lower. So a gigabit plan that reads 450 Mbps over Wi-Fi and 930 Mbps on a wire is not a broken plan, it is Wi-Fi behaving exactly as physics dictates.
A wired connection removes almost all of that: full-duplex, no contention, no radio retries. That is why a wired test is the right tool for measuring what the ISP actually delivers. It isolates the wide-area link so you are not accidentally measuring your own wireless environment. If you can only test over Wi-Fi, stand next to the router on the 5 GHz or 6 GHz band, and treat the result as a Wi-Fi number, not an ISP number.
- Wi-Fi is half-duplex and shared; PHY rate is not throughput
- Real Wi-Fi goodput is usually 40 to 60 percent of the negotiated PHY rate
- A 2x2 Wi-Fi 5 client (866 Mbps PHY) typically yields 350 to 500 Mbps actual
- Band, channel width, antennas, distance, and interference all cut wireless throughput
- Wired GbE reaches ~940 Mbps and isolates the ISP link from your wireless environment
- A far-below-plan Wi-Fi number with a near-plan wired number points to wireless, not the ISP
Server Distance, Latency, and Testing Under Load
Which server a test picks changes the answer. A nearby, well-connected server keeps round-trip time low, which lets TCP windows open quickly and makes it easy to reach the line's full capacity. A distant server raises latency and inflates the bandwidth-delay product, so single or few streams struggle and the number drops. Testing to a nearby server gives the cleanest capacity reading, but it also means you are only testing the first few miles of the path, not the wider internet your traffic actually crosses.
Server location on the network also matters, not just the map. Some ISPs host test servers on their own network (on-net), which never touches an interconnect and shows a best-case number. A third-party server may sit across a peering link that gets congested at peak hours, which is often where real-world slowdowns actually live. Running both an on-net and an off-net test, and repeating in the evening peak, tells you whether a slowdown is inside your ISP or at an interconnect between providers.
The most useful metric for how the connection feels is not raw throughput but latency under load, sometimes reported as a bufferbloat grade. Many tests measure idle ping only; a good one measures ping while the link is saturated. A connection that idles at 12 ms but jumps to 300 ms under load will feel sluggish on video calls and gaming no matter how high the download number is, because oversized buffers are queuing packets. Modern gateways with fq_codel or CAKE queue management keep that latency low under load.
- Nearby servers minimize RTT and give the cleanest capacity number, but test less of the path
- Distant servers raise latency and can suppress single/few-stream results
- On-net (ISP-hosted) servers avoid interconnects and read best-case; off-net crosses peering
- Repeat during the evening peak to expose interconnect or access-link congestion
- Latency under load (bufferbloat) predicts real-world feel better than peak throughput
- Look for smart queue management (fq_codel, CAKE) to control latency when the link is full
Why Browser Tests Read a Bit Low, and Download vs Upload
Browser-based tests run inside a JavaScript sandbox over HTTPS, and on very fast links that overhead shows up. The browser adds TLS encryption and decryption, HTTP framing, and per-tab CPU limits, and it generally cannot drive the network interface as hard as a native application can. On connections up to a few hundred Mbps the difference is small, but on multi-gigabit links a single browser tab often becomes CPU-bound on one core and under-reports, while a native desktop or mobile app that uses more connections and less overhead reads higher. For plans above roughly 1 Gbps, prefer a native app for the authoritative number.
Upload and download are measured separately and often differ dramatically because most residential access technologies are asymmetric by design. Cable (DOCSIS) and many fixed-wireless and DSL plans allocate far more spectrum to download than upload, so 900 Mbps down with 35 Mbps up is a normal cable profile, not a defect. Fiber (and business symmetric plans) typically deliver equal or near-equal upload. Upload results are also more sensitive to the client: generating traffic at line rate stresses the device's CPU and TCP send buffers more than receiving does.
Two environmental factors quietly cap both directions and are easy to overlook. An active VPN routes all traffic through a remote endpoint and adds encryption overhead, so it will cap and skew results. Traffic-scanning security software (some antivirus and endpoint suites inspect every packet) can throttle throughput on fast links. Disable or bypass both before an authoritative test, then re-enable them.
- Browser tests add TLS, HTTP, and per-tab CPU overhead and can be single-core bound
- On multi-gig plans, use a native app; browser tabs often under-report above ~1 Gbps
- Download and upload are separate; cable/DSL plans are asymmetric by design
- Symmetric upload usually means fiber or a business-grade symmetric plan
- Upload stresses the client's CPU and send buffers more than download
- VPNs and packet-inspecting security software cap and skew results; disable them for the test
How to Get a Number You Can Trust
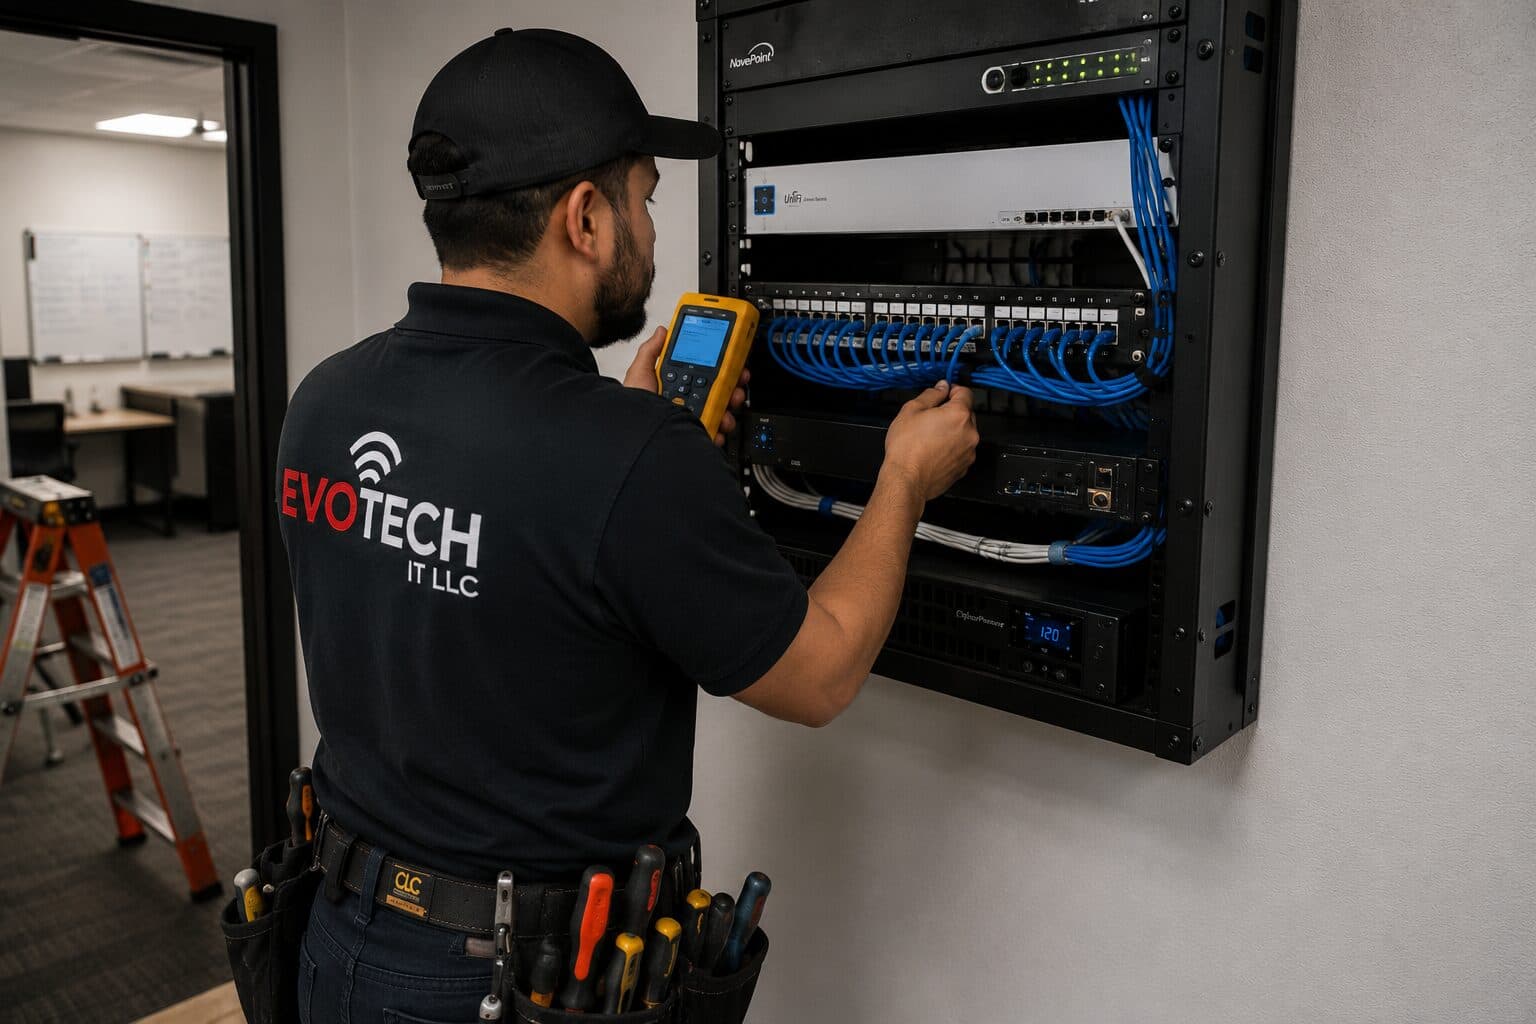
Put the whole procedure together and the goal is simple: make your own gear stop being the bottleneck so the test reads the ISP link. Connect a laptop by Ethernet directly to the router or gateway (not a downstream switch or powerline adapter), confirm the port and cable can carry your plan speed, and quit other apps, backups, and cloud sync. Pause any VPN and any traffic-scanning security tool. Then run the test.
Take several readings rather than one. Run three to five tests, note the median instead of the peak, and repeat with a second tool and a second server, including one off-net server and one run during the evening peak. Record both idle latency and latency under load. This handful of numbers, rather than a single screenshot, is what actually characterizes the connection and lets you tell a momentary blip from a real problem.
Interpret against your plan. On a wire, expect 90 to 94 percent of the provisioned rate; a little over is normal overprovisioning, and well under warrants a look. If the wired number is at plan but Wi-Fi is far lower, the issue is your wireless environment, coverage, band steering, channel congestion, or access-point placement, and a site survey rather than a faster plan is the fix. If even the wired number is well below plan across servers and times of day, the problem is upstream of your equipment and belongs with the ISP. That division, your network versus theirs, is the single most valuable thing an accurate test tells you.
- Test wired, directly into the gateway, with a port and cable rated for your plan
- Quit background apps and pause VPN and packet-inspecting security software first
- Run 3 to 5 times, use the median, and cross-check with a second tool and server
- Capture idle latency and latency under load, not just download and upload
- Wired should hit 90 to 94 percent of plan; a bit over is normal overprovisioning
- Wired at plan but slow Wi-Fi means a wireless/coverage issue, not a slow ISP
Frequently asked questions
Why is my speed test lower than the plan I pay for?
Some gap is expected: protocol overhead alone removes 6 to 10 percent, so a gigabit plan reads around 940 Mbps at best even on a perfect wired connection. Larger gaps usually come from testing over Wi-Fi, an underpowered device or a 1G port on a faster plan, background apps, a VPN, or peak-hour congestion. Test wired, directly into the gateway, with other traffic paused. If a wired test still reads well below the plan across multiple servers and times of day, the shortfall is upstream and worth raising with your ISP.
Should I trust my ISP's own speed test or a third-party one?
Use both, because they answer different questions. An ISP-hosted (on-net) server never crosses an interconnect, so it shows the best case your access link can do and is good for confirming the line itself is healthy. A third-party server often crosses a peering link between networks, which is where real-world evening slowdowns frequently occur, so it better reflects everyday experience. If the on-net test is fast but off-net tests are slow at peak, the bottleneck is likely an interconnect rather than your access link.
Why does my phone show a different speed than my laptop on the same Wi-Fi?
Devices have different radios and CPUs. Many phones use a single-antenna (1x1) Wi-Fi radio while a laptop may have a two-antenna (2x2) radio, roughly doubling the laptop's potential throughput. Band selection (2.4 vs 5 vs 6 GHz), distance to the access point, and the phone's ability to sustain the test also differ. On fast links the phone typically reads lower. To compare the actual internet link rather than the devices, test each one wired, or stand right next to the router on the same band.
My download is 900 Mbps but upload is only 35 Mbps. Is something broken?
Almost certainly not. Most residential cable (DOCSIS), fixed-wireless, and DSL plans are asymmetric by design, allocating far more capacity to download than upload, so a large gap is the expected profile. Symmetric or near-symmetric upload is generally a feature of fiber and business-grade plans. If upload matters for you (video calls, cloud backup, hosting), check whether a symmetric or fiber plan is available rather than treating the asymmetry as a fault.
How many times should I run a speed test?
Run it three to five times and use the median, not the single highest reading. One test can be skewed by a momentary background transfer, a Wi-Fi retry burst, or a busy server. Repeating also reveals variance, which is itself informative: a consistent number means a stable bottleneck, while wild swings suggest congestion or a flaky link. For a full picture, also repeat with a second tool, a second server, and once during the evening peak.